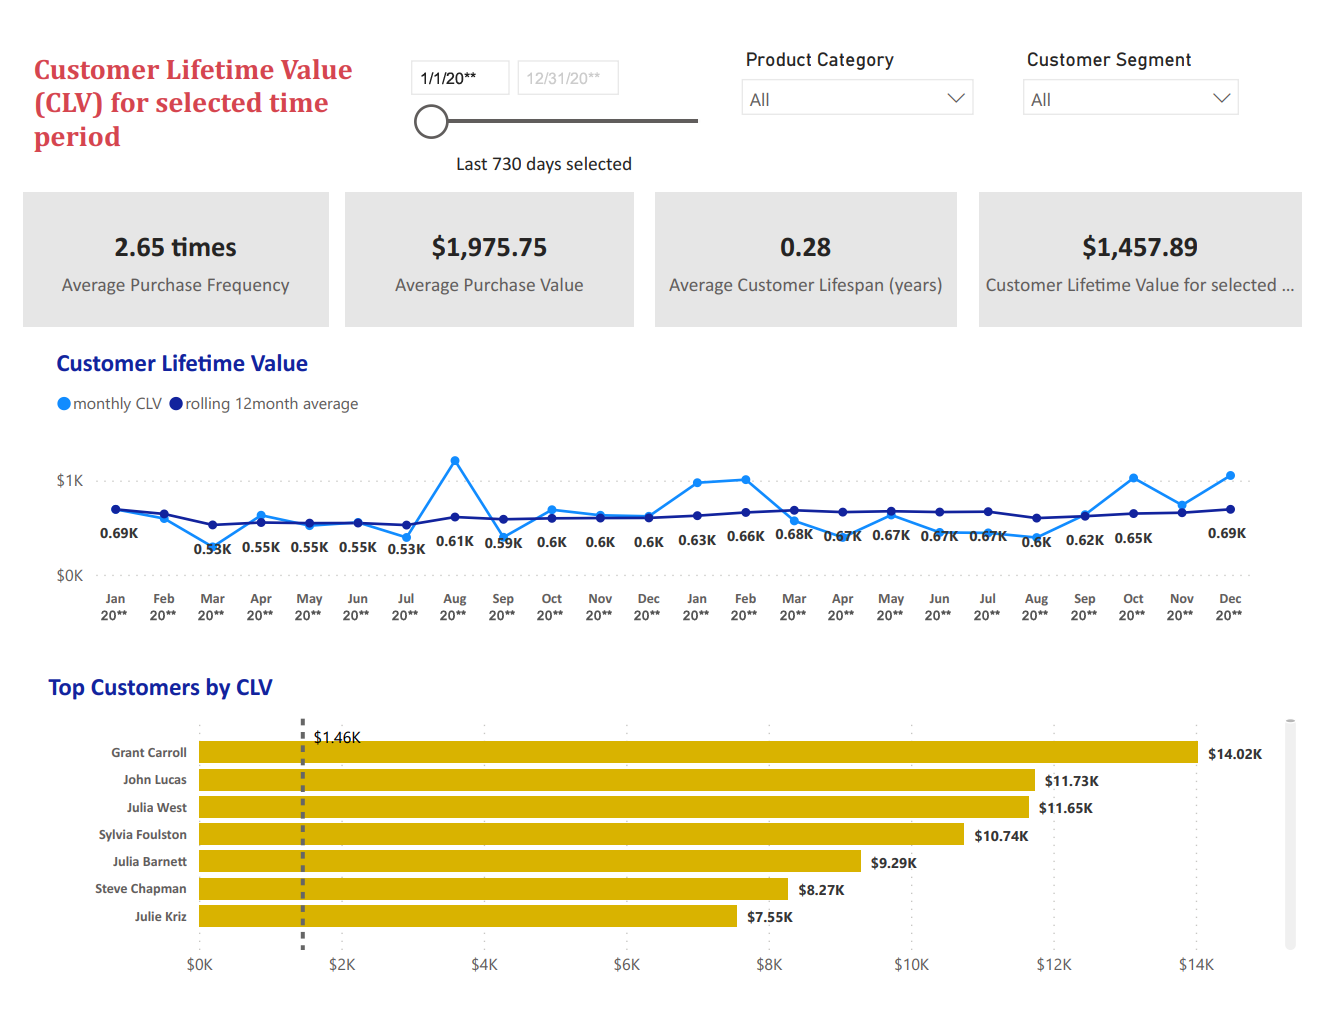
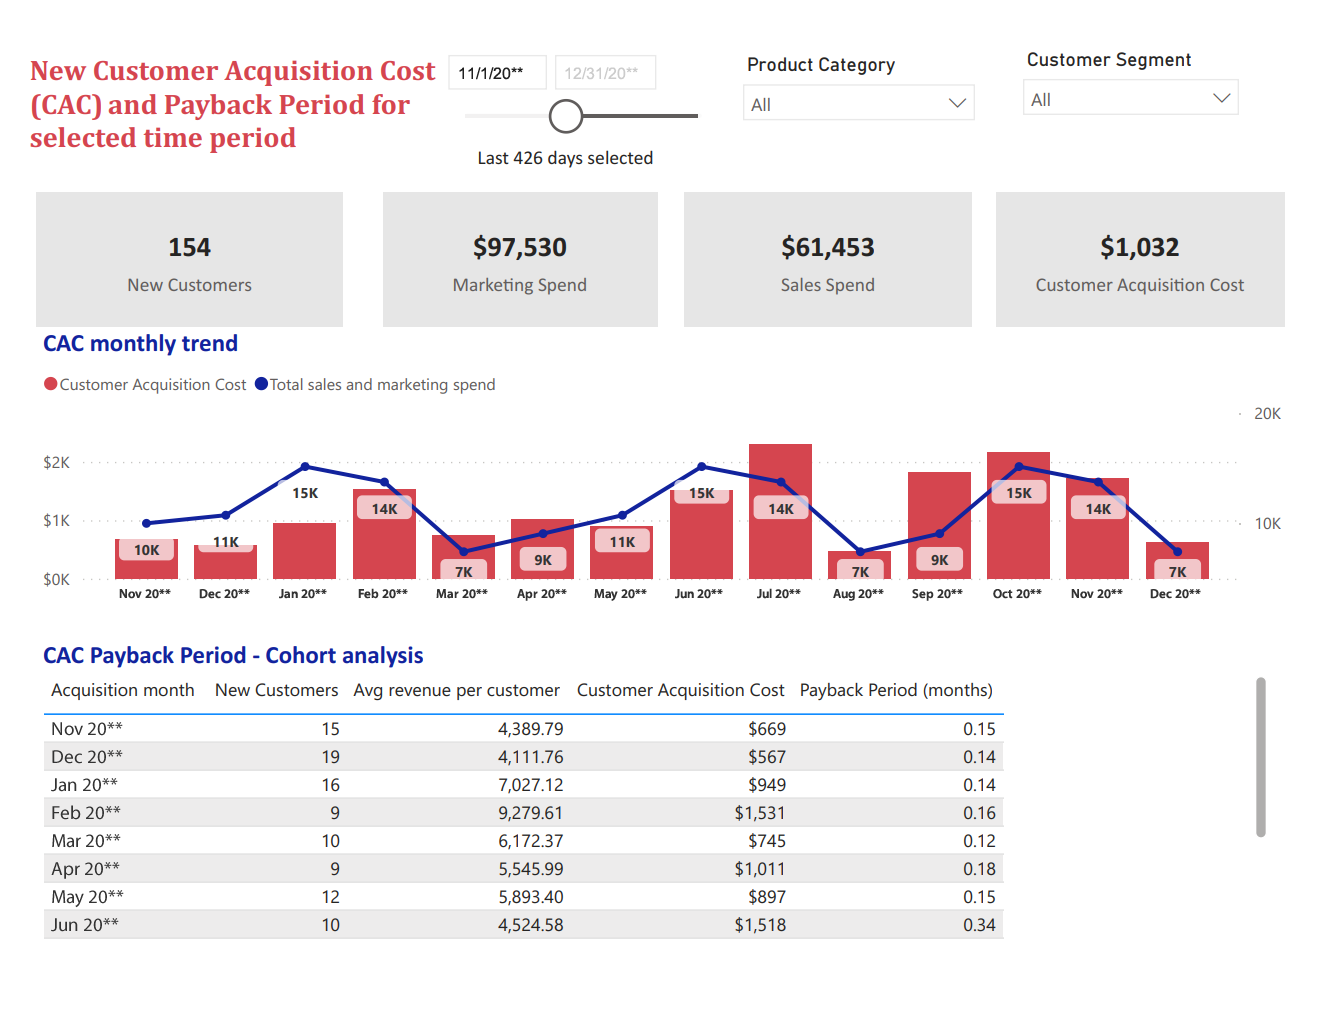
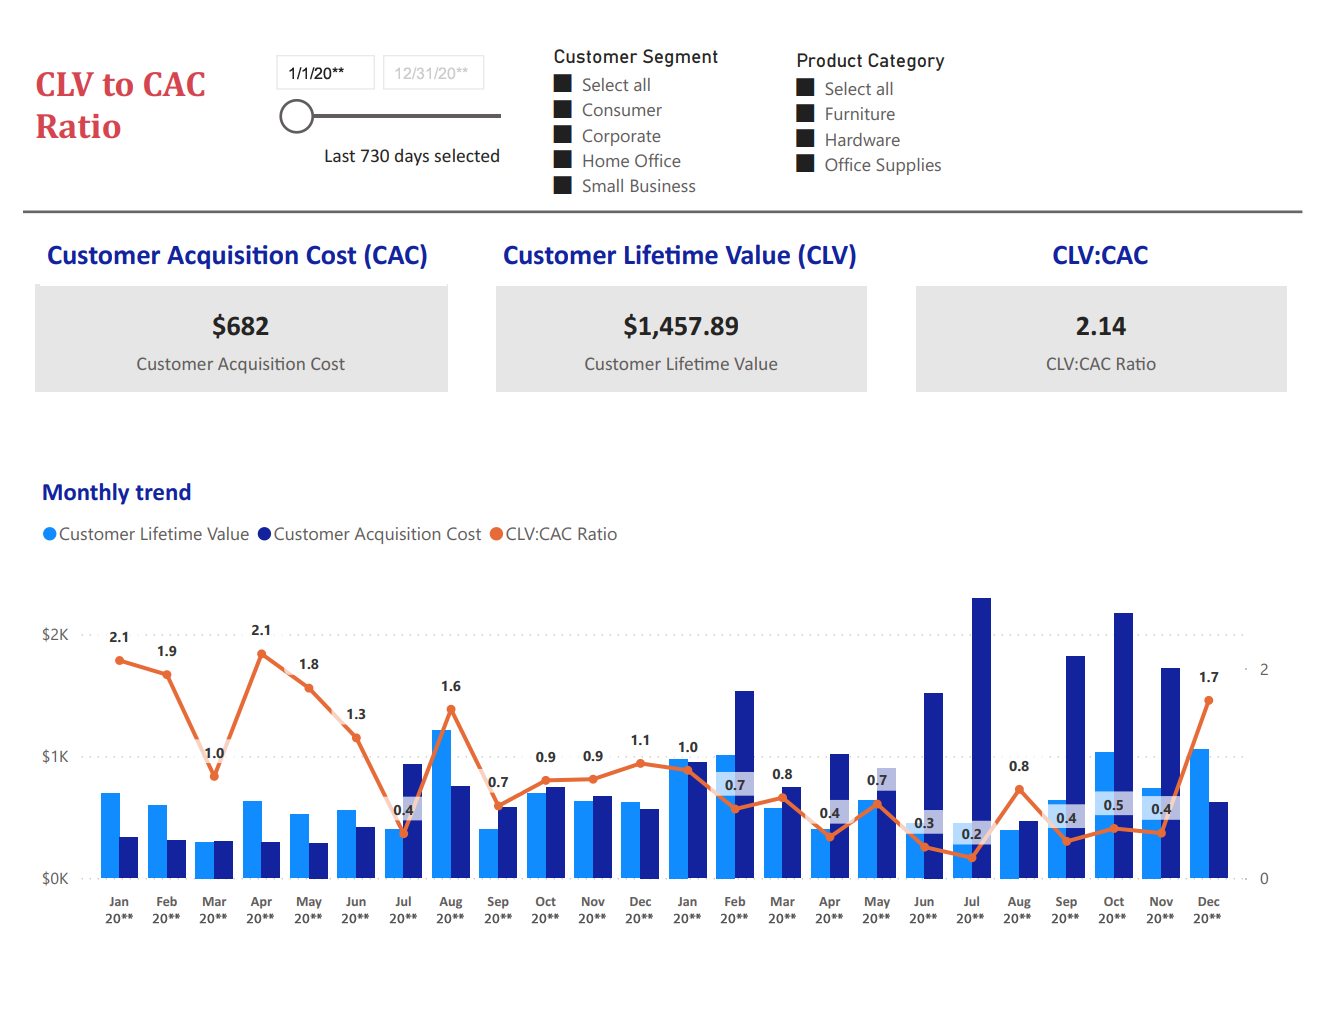
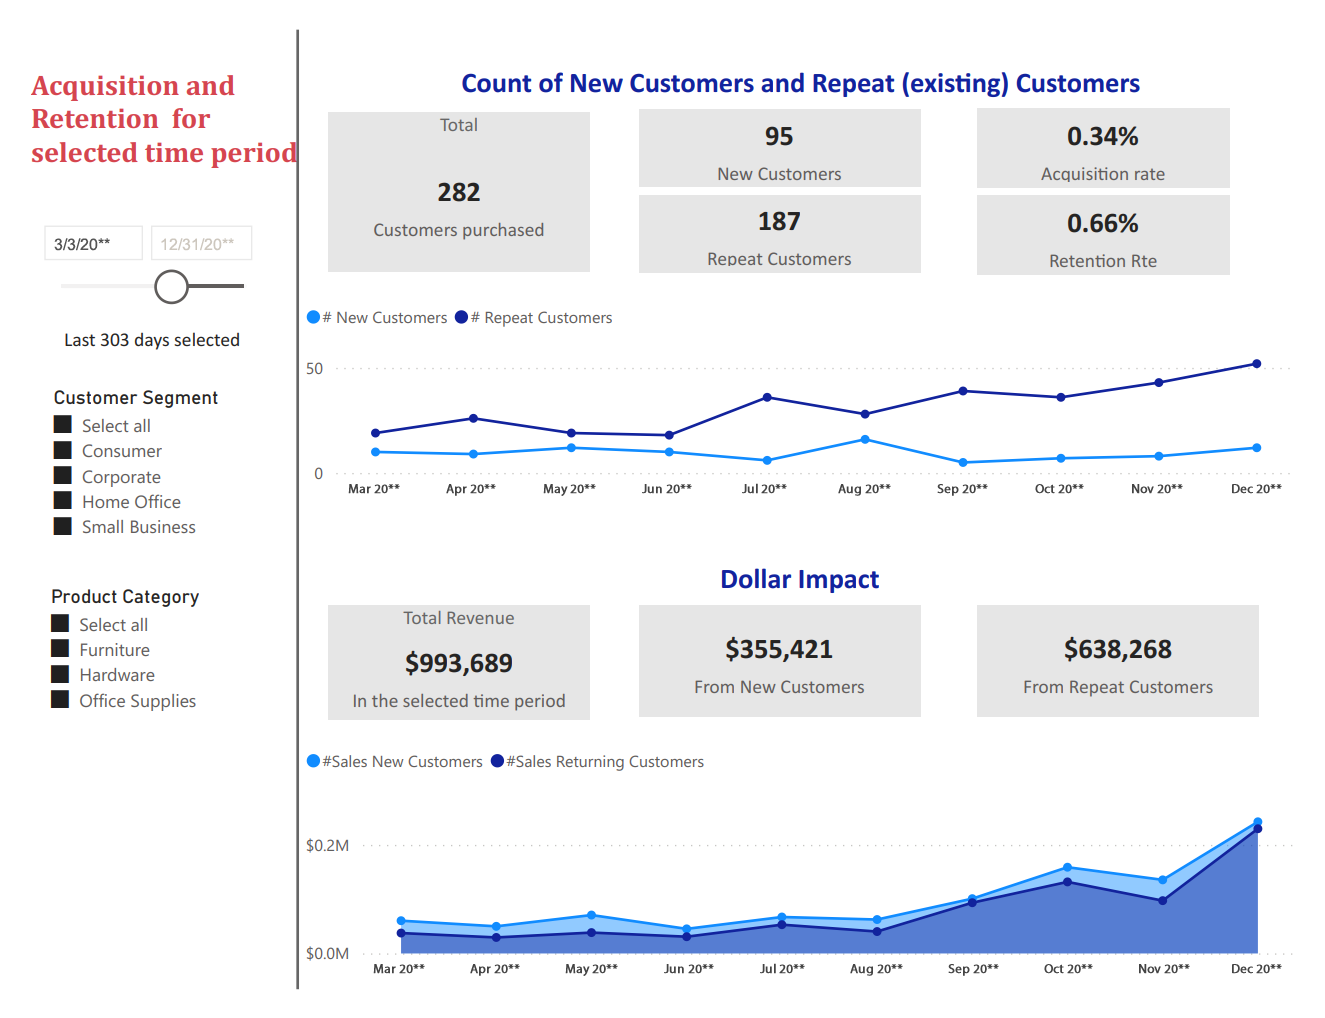
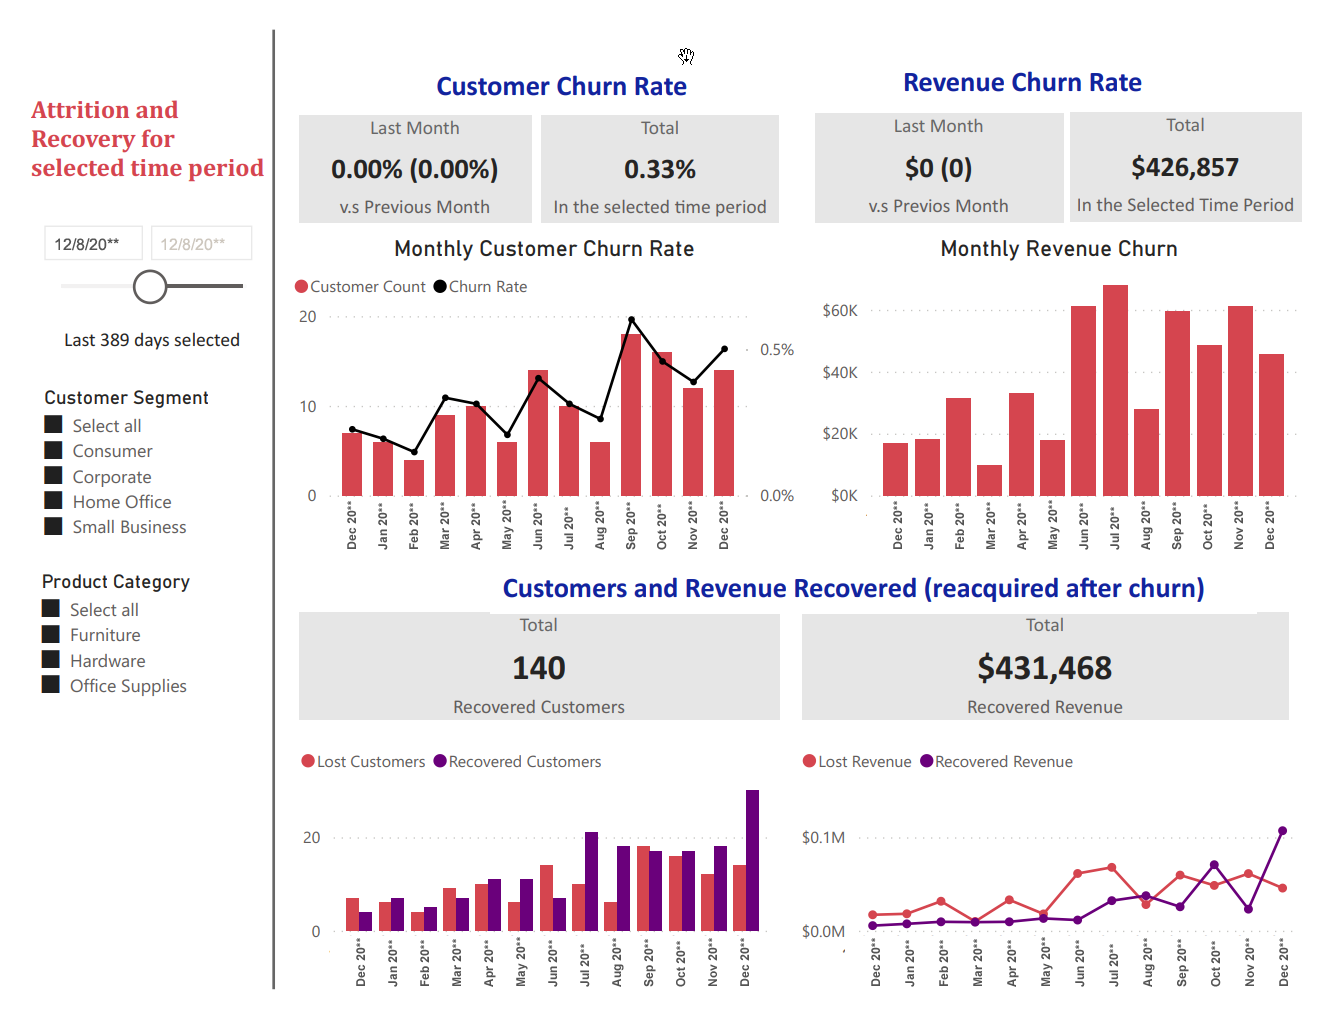
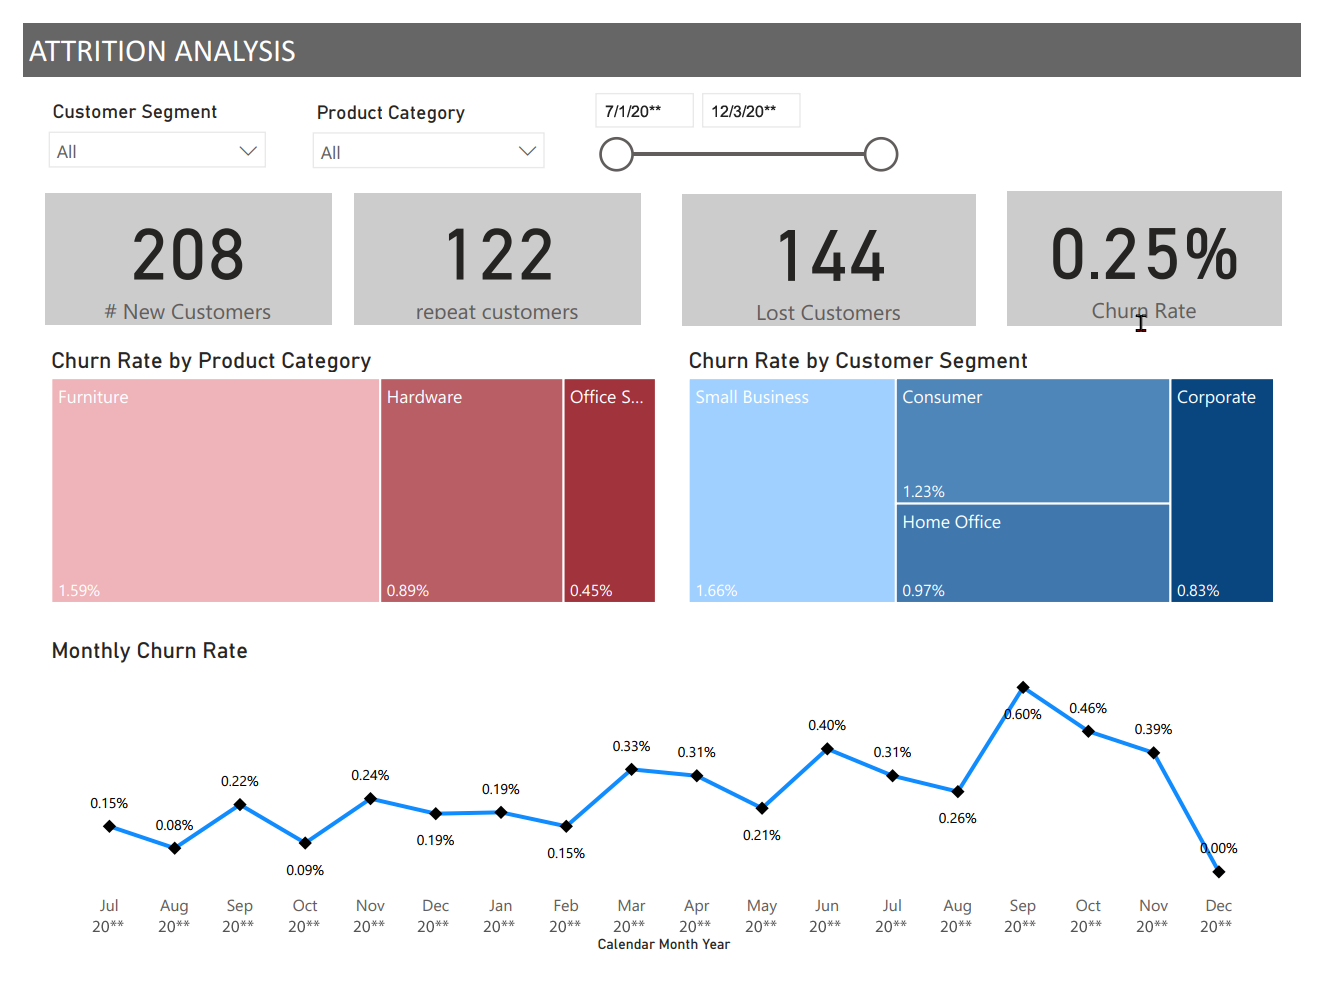
Power BI brings your data to life with a rich set of data visualization tools. These visualizations help you:
- See patterns and trends in your data that might be hidden in spreadsheets.
- Communicate complex information clearly and concisely to any audience.
- Create interactive dashboards that let users explore your data in real-time.
With Power BI's visual representation, you can turn data into insights that drive better decision-making.
