logo__gainops__ms__gain_power_bi__wh
logo__gainops__ms__gain_power_bi

Transform your organization
with Power BI Consulting

Companies today need advanced tools to adopt the data-driven model, build business intelligence. We can elevate and transform your Power BI capabilities to deliver high-quality and accurate insights used to make business decisions.
powerBI-Logo
We are experts in AI. Microsoft’s AI, called Copilot helps you use the transformational power of generative AI to get the most from your data.
powerbi_copilot

Maximize Power BI

Unlock hidden insights within your data, create visually compelling reports, and drive actionable outcomes

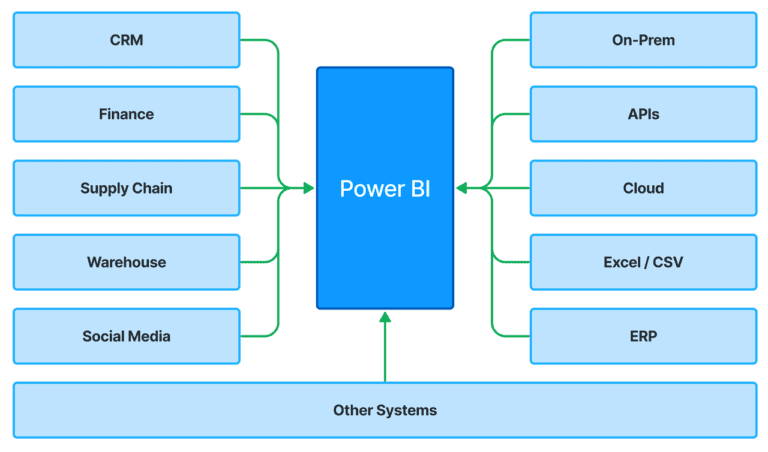
Data AcquisitionPower BI uses data acquisition which is retrieving data from external data sources, exporting and then changing the data for analysis. Since Power BI supports a variety of connectors (such as databases, Excel files and web services as well as any cloud platform), users can have data from various places. Once the data has been acquired, it can be cleaned, structured, loaded to Power BI for visualization and reporting so that businesses can make meaningful, data based decisions without error or risk of oversight.

Read More
powerbi_sources__4
powerbi_workflow__2

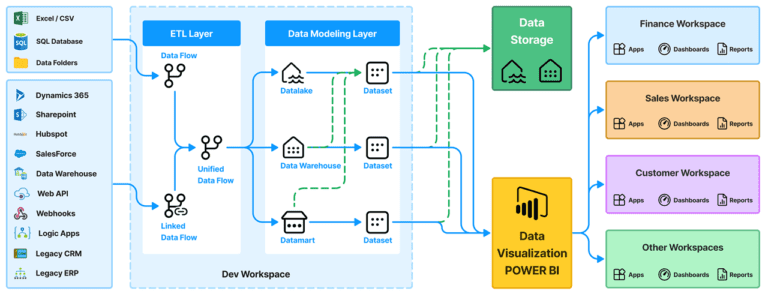
Data ModellingData modeling in Power BI is how you structure and organize your data into readable formats, so you can then create meaningful relationships, calculations, and answers. It consists of specifying tables, associating them in relationships and building measures or computed columns based with DAX (Data Analysis Expressions). An efficient query and visualization of the data model will enhance the report efficiency and accuracy. If the data model is optimized, it becomes easy for users to create interactive dashboards and insights, which in turn helps users make data driven decision making more effective.

Read More

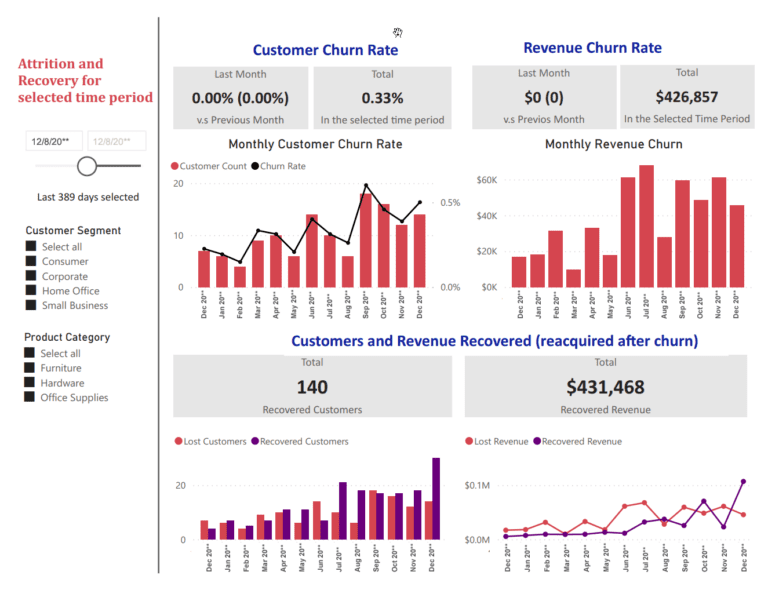
Data VisualizationPower BI uses data visualization to transform raw data into interactive, easy to understand reports and dashboards. While the visualizations in ChartCleer can be chart of your liking, they mainly unite using a collection of charts, graphs, and maps that allow users to explore and dig into trends and patterns with visualizations, as well as providing a set of reporting tools that allow to draw conclusions and create a document of findings. Power BI’s graphical interface is very simple and thus makes analyses in real time too easy and intuitive. Data visualization that facilitates businesses to develop informed decision making, allows complex data to be presented in a user friendly and actionable format.

Read More
powerbi_dashboard__204___churn_and_recovery
fabric_console
Integrate your Numbers Do you wonder how to combine your numbers into a more complicated, immersive practice? Using tools such as Power BI or simply advanced data analytics platforms, you can consolidate disparate data sources into real, interactive dashboards. Thanks to these platforms users can see their data in a way that is simple, easy and actionable. If your numbers aren’t plugged into a system, then you’re making decisions with blinders on. Integrating your numbers on real-time reports or predictive analytic metrics will help organically drive more strategic, data-driven practices across your organization.
Read More

Typical Problems We Solve

Some of the Problems we Solve for our Clients
  • Which reps are not meeting quota
  • Which Reps are struggling to meet revenue targets
  • Revenue Forecasts vs. plan / target
  • Customer Acquisition Cost (CAC)
  • Customer Churn
  • Rep Churn
  • Intersection of Sales rep, product and Customer
  • Product 360
  • Org Growth Curve
  • Performance each sales teams
  • Customer satisfaction levels
  • Data from multiple systems / Disparate Data systems
  • Little information but lots of data
  • Incentive compensation (IC) map
  • Where the Reps lose deals / money
  • Discounting Behaviour
  • Supply chain performance
  • Vendor performance
  • Customer 360
  • Rep 360
  • Support ticket status
  • Quote to cash
  • Promise dates
Tell me More

Use GainOps' expert consultants
and transform your organisation

Leverage GainOps' team of expert consultants to unlock the full potential of your organization. Our deep knowledge and proven methodologies can transform how you operate.

Partner with GainOps and unlock the path to sustainable success.
Streamline processes and boost efficiency.
Gain a deeper understanding of your customers.
Optimize costs and maximize profitability.
Empower your workforce to make data-driven decisions.
Achieve a significant competitive advantage.

Why GainOps Consulting

Our team of Power Bi experts will work closely with you to build customized dashboards and scoreboards that provide clear, concise insights at a glance. With our expertise, you can unlock the full potential of your data, identify key trends, and discover actionable next steps that drive business growth. Don't let valuable opportunities slip through your fingers - partner with GainOps today for unparalleled data-driven success!

  • Strategic Conversations
  • Deployment
  • Team Readiness
  • Reporting Standards
  • Security Management
  • Data Governance
  • Compliance
  • Data Architecture
  • Updates / Upgrades
  • Data Culture

GainOps has helped these companies learn more about what's happening inside their own operations, and we've been there to help them with:

  • client_logo__row1
  • client_logo__row2
  • client_logo__row3
  • client_logo__row4
  • mobile__client_logo__01
  • mobile__client_logo__02
  • mobile__client_logo__03
  • mobile__client_logo__04
  • mobile__client_logo__05
  • mobile__client_logo__06
  • mobile__client_logo__07
  • mobile__client_logo__08
  • mobile__client_logo__09
  • mobile__client_logo__10

Talk to us about your Power BI project

Talk to us about your
Power BI project

linkedin facebook pinterest youtube rss twitter instagram facebook-blank rss-blank linkedin-blank pinterest youtube twitter instagram